Field notes
Memory management in JavaScript
You can think of computer memory as a large number of flip flops you can access by unique identifier. Each of them can store one bit. 8 bits form one byte. 4 bytes (on 32-bit systems) or 8 bytes (on 64-bit systems) form one word. Words are organized into pages. V8 for example organizes the heap into pages of a fixed size (256 KB). Page also stores overhead in the form of metadata containing marked bitmap. For each word there is one bit reserved in bitmap.
Static memory allocation
This memory allocation happens right before the code is executed.
When we define a variable of primitive type in code compiler calculates memory consumption based on its type. Then the required memory is allocated in the Call Stack. Primitive types in JavaScript are numbers, strings, booleans, undefined and null. Call Stack is also a place where references pointing to objects and functions we create are stored. That’s possible because at compile time compiler knows the required size needed for storing reference.
Call Stack
Call Stack is a mechanism used to keep track of function invocations. It basically determines where we are when it comes to code execution. When you call a function it will be added on top of the Stack. If this function calls another one, that function will also be added on top of the Stack above the previous one. When function finishes its execution it will be removed from Stack.
Here is the visualization of how Call Stack would look like at different steps if you run this code:
const formatDate = (date, locale = "en-US") => {
  const formattedDate = date.toLocaleString(locale);
  return formattedDate;
};

console.log(formatDate(currDate));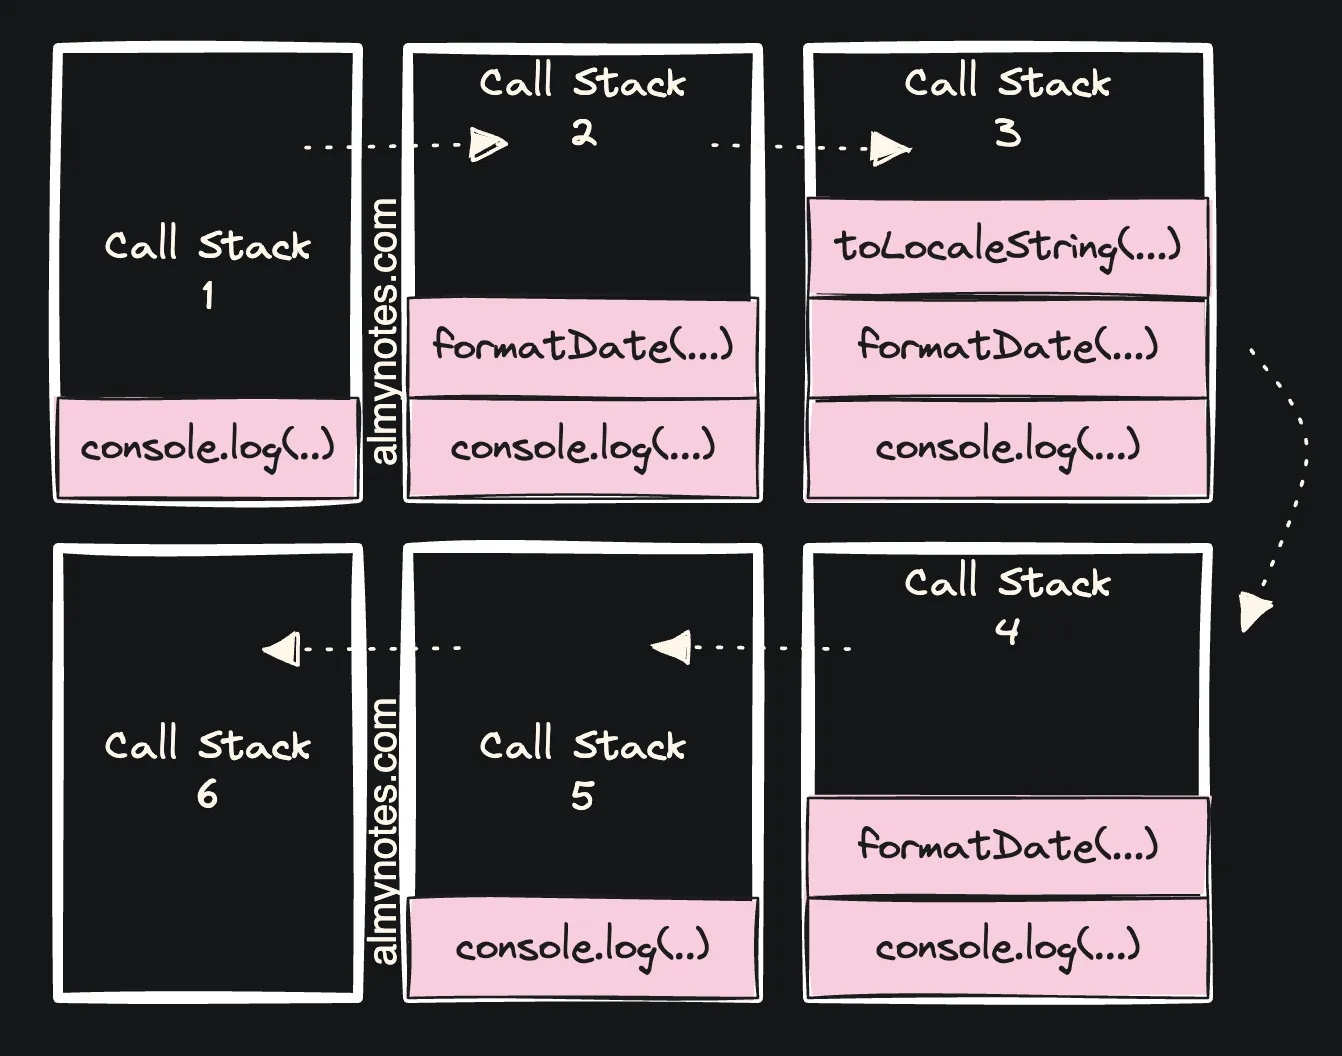
Dynamic memory allocation
When the variable we define is not primitive, e.g. object, array or function, the amount of memory is unknown at compile time and allocation is happening in the Heap. For this type of variables the engine allocates memory as needed at the moment. It’s worth noting that variable itself, the reference pointing to object, will still be stored on Call Stack. It means that variable only points to the object in Heap.
Garbage collection
When the variable becomes unneeded the memory should be released. In JavaScript garbage collector is responsible for freeing memory. The big question here is to understand which memory is unused. There are several algorithms used most often to detect unused variables and release the allocated memory. Most of them rely on objects references to tell if memory they occupy can be freed or not. The object is considered live if it is referenced by root object or another active object.
Reference-counting
In a nutshell it maintains a table with objects and number of references to them. If there are no references to an object it becomes a candidate for clean up. Conceptually the algorithm is simple to understand. But it has a major flaw: if there is a cycle, i.e. several variables referencing each other, their reference counter will never go to zero.
const connectFriends = () => {
  var user1 = {};
  var user2 = {};
  user1.friend = user2;
  user2.friend = user1; // cyclic reference
};

connectFriends();
This is rather naive approach rarely used in browsers nowadays.
Mark-and-sweep
This approach is utilized by modern browsers.
Mark
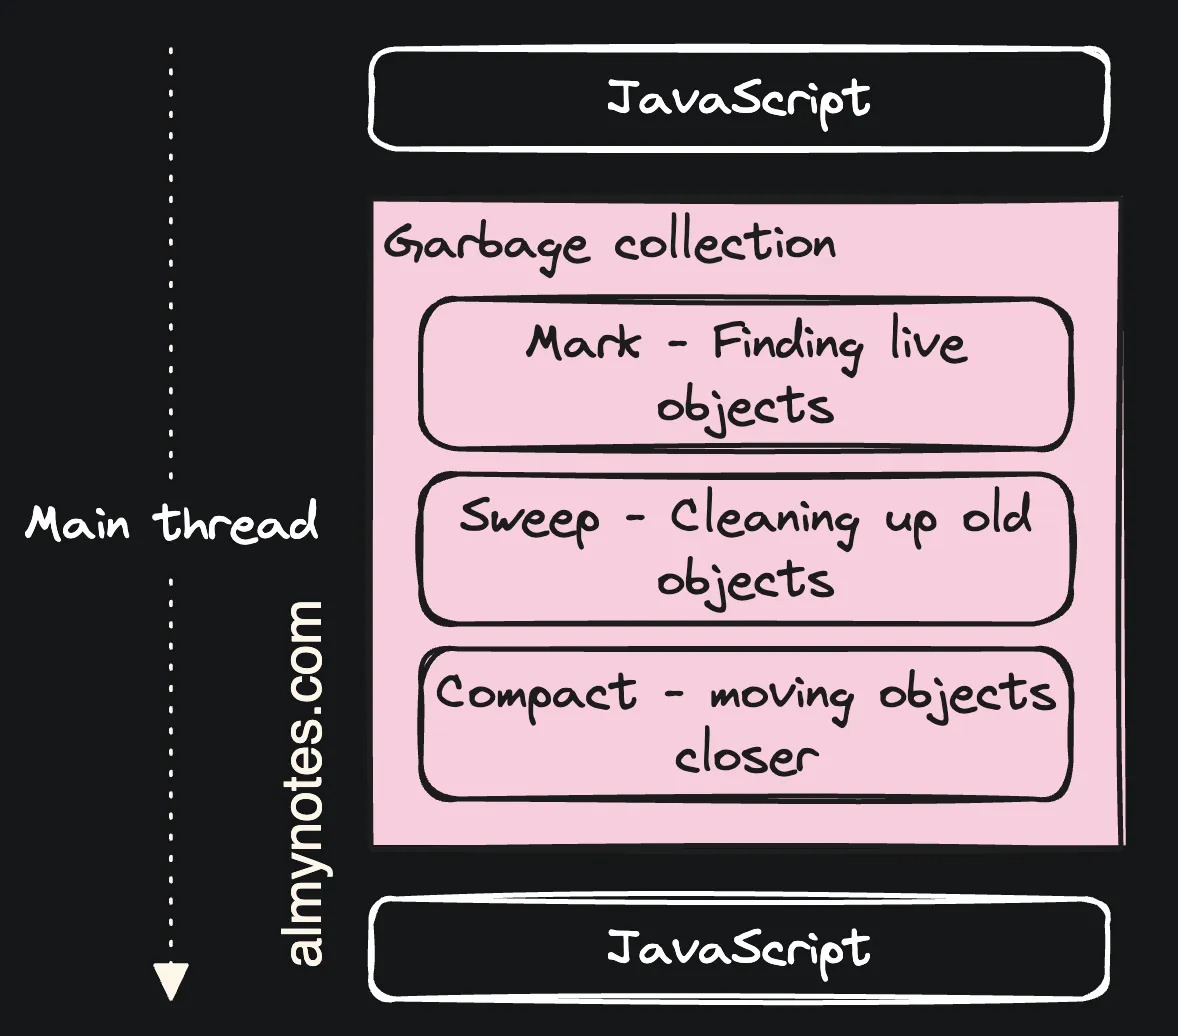
In order to detect unused memory it traverses variables starting from the roots. Roots are global variables referenced in the code, they are live by definition. Think of window in JavaScript.
While traversing the algorithm marks roots and children accessible from roots as active. When it’s done anything that left unmarked is considered a garbage and can be disposed.
To understand marking we can refer to tri-color marking abstraction. It uses colors to represent states of the objects in heap with the following meaning:
- White - represents the objects which haven’t been processed yet
- Grey - object itself has been processed, but its children have not
- Black - object has been processed completely.
Sweep After previous stage is complete we need to free unused memory and return it to OS. This happens during Sweep phase and when it’s complete previously occupied space is added to free lists in memory page.
Compact This is a stage during which JavaScript engine optimizes usage of space and moves objects so memory pages become less fragmented. Freed up pages are released back to OS.
The approach described above solves the issue with cyclical references, as long as object is not accessible from the root it can be deleted.
Garbage collection optimizations
It’s worth noting that garbage collection process requires the main thread to pause. For this reason multiple optimizations are typically introduced to reduce the time and number of cycles needed for garbage collection. In practice modern browsers utilize incremental marking and lazy sweeping techniques to speed up garbage collection cycles.
Heap memory is typically divided into multiple segments each serving different purpose in order to minimize the area of garbage collection and speed up further cycles.
Young Generation is a name of new objects allocated in New space. This space is typically small and is designed to be scavenged very fast.
New space is divided into two parts: ToSpace and FromSpace. Allocations of memory for new variables is happening in ToSpace. There is an allocation pointer which is incremented whenever there is a need to reserve space. Once the pointer reaches the end of New space JavaScript engine starts scavenging process. All the accessible variables are copied into FromSpace or promoted to Old space, dead objects are left behind. Then the two spaces swap roles. So further allocation continues to happen in the ToSpace.
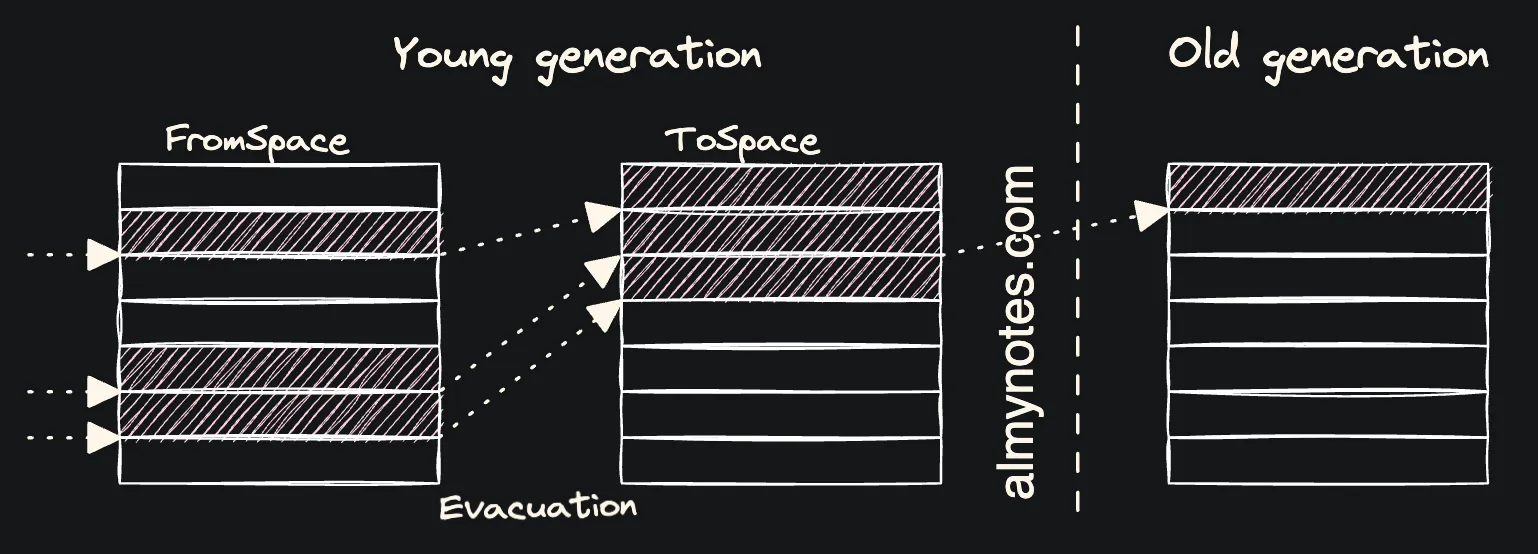
Old space contains most objects if they have pointers from other objects. Such objects are called Old Generation and get promoted to this space after surviving garbage collection in New space. Running garbage collection in this space is expensive so it isn’t run as often as in New space. This space will be garbage collected during mark-sweep and mark-compact phases which are much less frequent.
Large object space contains objects larger than the size limits of other spaces. This space is never compacted by garbage collector.
Code space includes JIT compiler instructions.
Memory leaks
It’s a situation when the memory consumption grows over time and never drops. Further iterations of garbage collector free less and less memory. The allocation pointer moves further and further without memory cleanup until the process crashes with an out-of-memory error (in Node.js it looks like JavaScript heap out of memory).
Causes can be different, but the most common are:
- Defining global variables
- Usage of timers, callbacks, event handlers and other resources without unsubscribing from them
- Closures
Update 2026: pauses are mostly a solved problem
The “garbage collection pauses the main thread” caveat above deserves a modern footnote. V8’s Orinoco project moved most of the collector off the main thread: young-generation scavenging runs on parallel helper threads, and old-generation marking happens concurrently while your JavaScript keeps executing. The main thread still pauses, but for short bookkeeping steps rather than full collection cycles. The days of GC visibly freezing a page are largely behind us.
The language also grew explicit hooks into the collector, WeakRef and FinalizationRegistry, which let you hold a reference without keeping the object alive. Useful for caches, but the spec itself warns against building logic on when finalizers fire: GC timing remains deliberately unobservable, and the fundamentals in this post are exactly why.